Quick Start
Overview
This article is a walk-through for the new Altergo user to understand the platform features at a glance. It covers an example use case having a customer requirements and respective Altergo integration
Use case
An Air conditioners installation and maintenance company is providing their service for maintaining the server rooms of IT firms. Since holding Temperature and Humidity values within a tight tolerance is critical to the IT system's reliability, monitoring devices with temperature and humidity sensors are installed throughout the server room
This company is expecting an asset management system that can fulfill the following requirements
Requirements
1. Ease of uploading/accessing sensor data from monitoring device in the cloud 2. Create automatic alerts when conditions within the server room deviate from defined tolerances (Temperature : 18°C to 25°C and Humidity(Relative humidity): 40% to 60%) 3. Group the monitoring devices based on geographical location and year of commissioning 4. Visualize both historical and real-time data from the monitoring device for the IT firm officials to inspect 5. Track maintenance activities and sensor replacement done on monitoring devices 6. Automate generation of monthly sensor data report
Altergo integration
This section analyzes how Altergo can be integrated with the workflow of the air conditioning company to tackle their requirements.
Blueprint
A Blueprint is a digital twin of physical/virtual entities of a system or the whole system itself.Interactions of the user with the Altergo platform commence with blueprint creation of the entity to be analyzed.
Here, the blueprint for the temperature and humidity monitoring device called Climate Controller is created
Created Blueprint 
Sensors
Altergo Sensors are virtual connectors to any IoT device. They are responsible for storing the uploaded data under the right feature name. Temperature and Humidity are the sensors for Climate Controller blueprint.
Creating the Humidity sensor is illustrated here

Assets
Assets are the instantiations of a blueprint. Analogous to Object Oriented Programming (OOP) where many Objects can be instantiated from a Class. Likewise, countless assets can be created from a blueprint.
Here an asset called CC_1is instantiated from the Climate Controller blueprint. This CC_1 represents one of the climate controller devices the company has installed.
The user can create a new asset on the Altergo platform via two methods:
- Directly on the platform using the UI. Covered in this article
- Using ION SDK

Created Asset
.png)
All the data generated from the installed device can be ingested to the CC_1 asset in the Altergo platform and can be accessed and analyzed further.
The user can ingest data to an asset on the Altergo platform via two methods:
- Directly on the platform using the UI. Covered in this article
- Using ION SDK

Alerts
Alerts is a fault detection and notification service offered by Altergo. The service sends Platform notifications, Emailsand Text messages to make the user cautious when an abnormality is observed in any of the sensor data.
The user can set up alerts for any kind of sensor data deviation. For the CC_1 asset the user needs to get notified for Low temperature, High temperature, Low humidity and High humidity occurrences in sensor data.
Creating a Low temperature alert is illustrated here

Created alert .png)
Tags
Tags are an asset management feature allowing the user to creat fleet of assets. The user can conduct aggregate-level analysis or visualization over multiple assets by grouping them together under a standard tag.
Here the user needs to group the assets based on geographical locations and year of commission. So respective tags called Canada and 2021 are assigned to the CC_1 asset.

Once tags are assigned, all the assets under the same tag can be fetched together and if needed, the user can perform fleet-level analysis .
Visualization Tool and Dashboards
Visualization Tool allows the user to visualize and analyze asset data. Interactive graphs using plotlyare generated for the sensor data within an asset.
Once temperature and humidity data get uploaded to the CC_1 asset, the visualization tool enables the user to visualize the data as per requirement.
.gif)
Visualized data
.png)
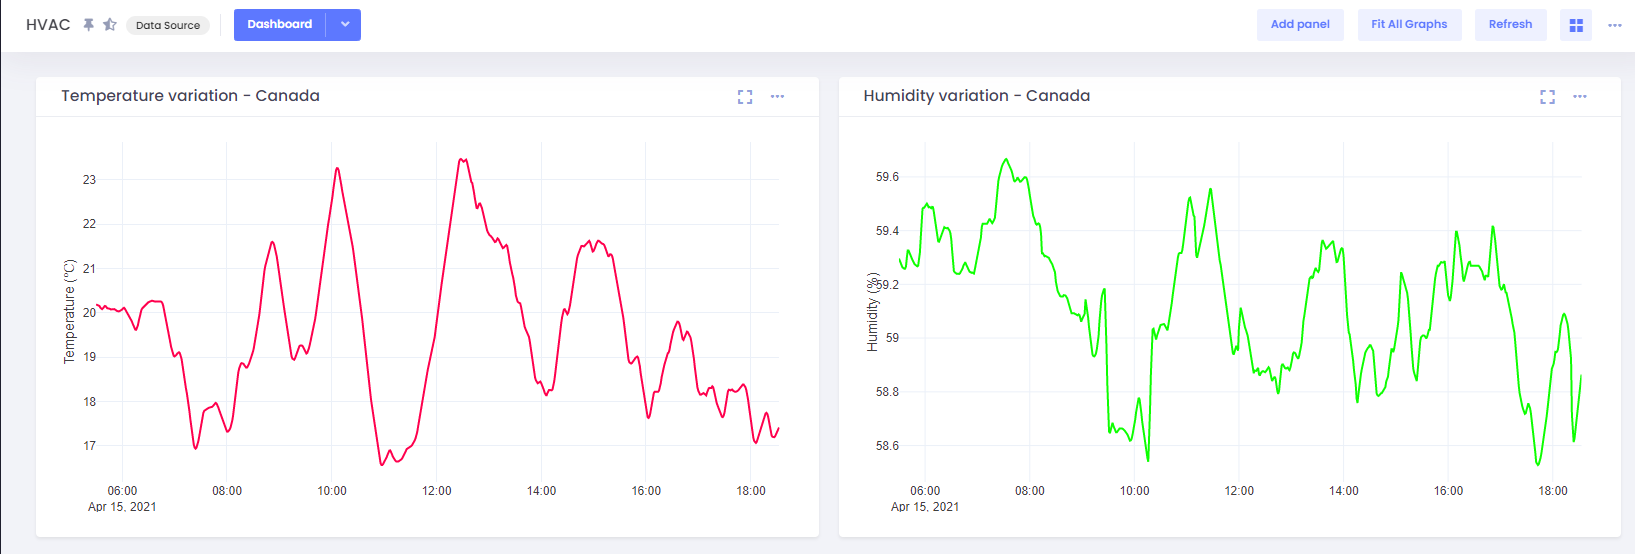
Dashboards enable the user to monitor and analyze the fleet-level aggregate performance of assets.
In this case, if the user needs to analyze the temperature variation across all the monitoring devices (Climate Controller)within a geographical location (let the location be Canada), then the user can create a dashboard including Canada as a tag. The dashboard returns an aggregate visualization of the temperature data from all the Climate Controller assets under the Canada tag.
.gif)
Created Dashboard
Dashboards can also visualize Real-time data
Activities
Activities is an Altergo feature allowing the user to label specific timeframes of an entity's lifetime. Each activity is bound by a start time and an end time.
Adding an activity called Maintenance/ Sensor replacement enables the user to keep the record and track down the maintenance activities and sensor replacements done on the particular asset.

Generated activity
.png)
Function manager and Datasets
Function manager is a feature of Altergo to upload, integrate and run python notebook within the platform. Functions, Programs and Automations are the three subsections of function manager.
- Functions are user-defined python notebooks performing unique tasks
- Programs links and executes the defined functions
- Automations pre-schedule the execution of a program
Datasets is an Altergo feature allowing the user to attach a companion file to any entities within the platform.
The user can combine the features of Function manager and Datasets with ION SDK to create automated monthly sensor data reports
- Create a python notebook that fetches data from the asset and creates a sensor report
- Use ION SDK method of the datasets to attach the sensor data report to the corresponding asset
- Upload the notebook as a function and create a program
- Use automation to schedule running the notebook once every month
User can download Sensor data reports as Datasets from the platform